What is PlayPen? Unconventional Exploration
 PlayPen has application in both simple conventional and unconventional evaluations. Projects do not need a defined play structure giving flexibility for unconventional workflows. However, discovery and well failure data cannot be collected, collated and analysed- as offered in the full Player product.
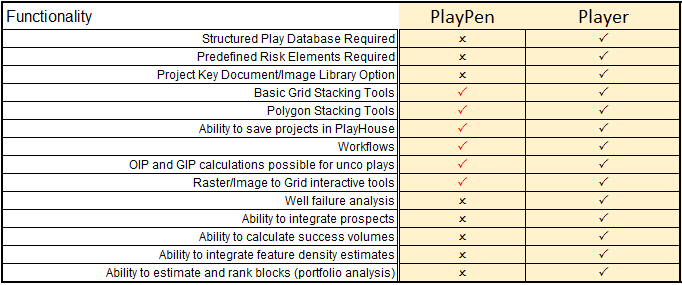
A comparison of functionality offered in PlayPen vs Player is shown below:
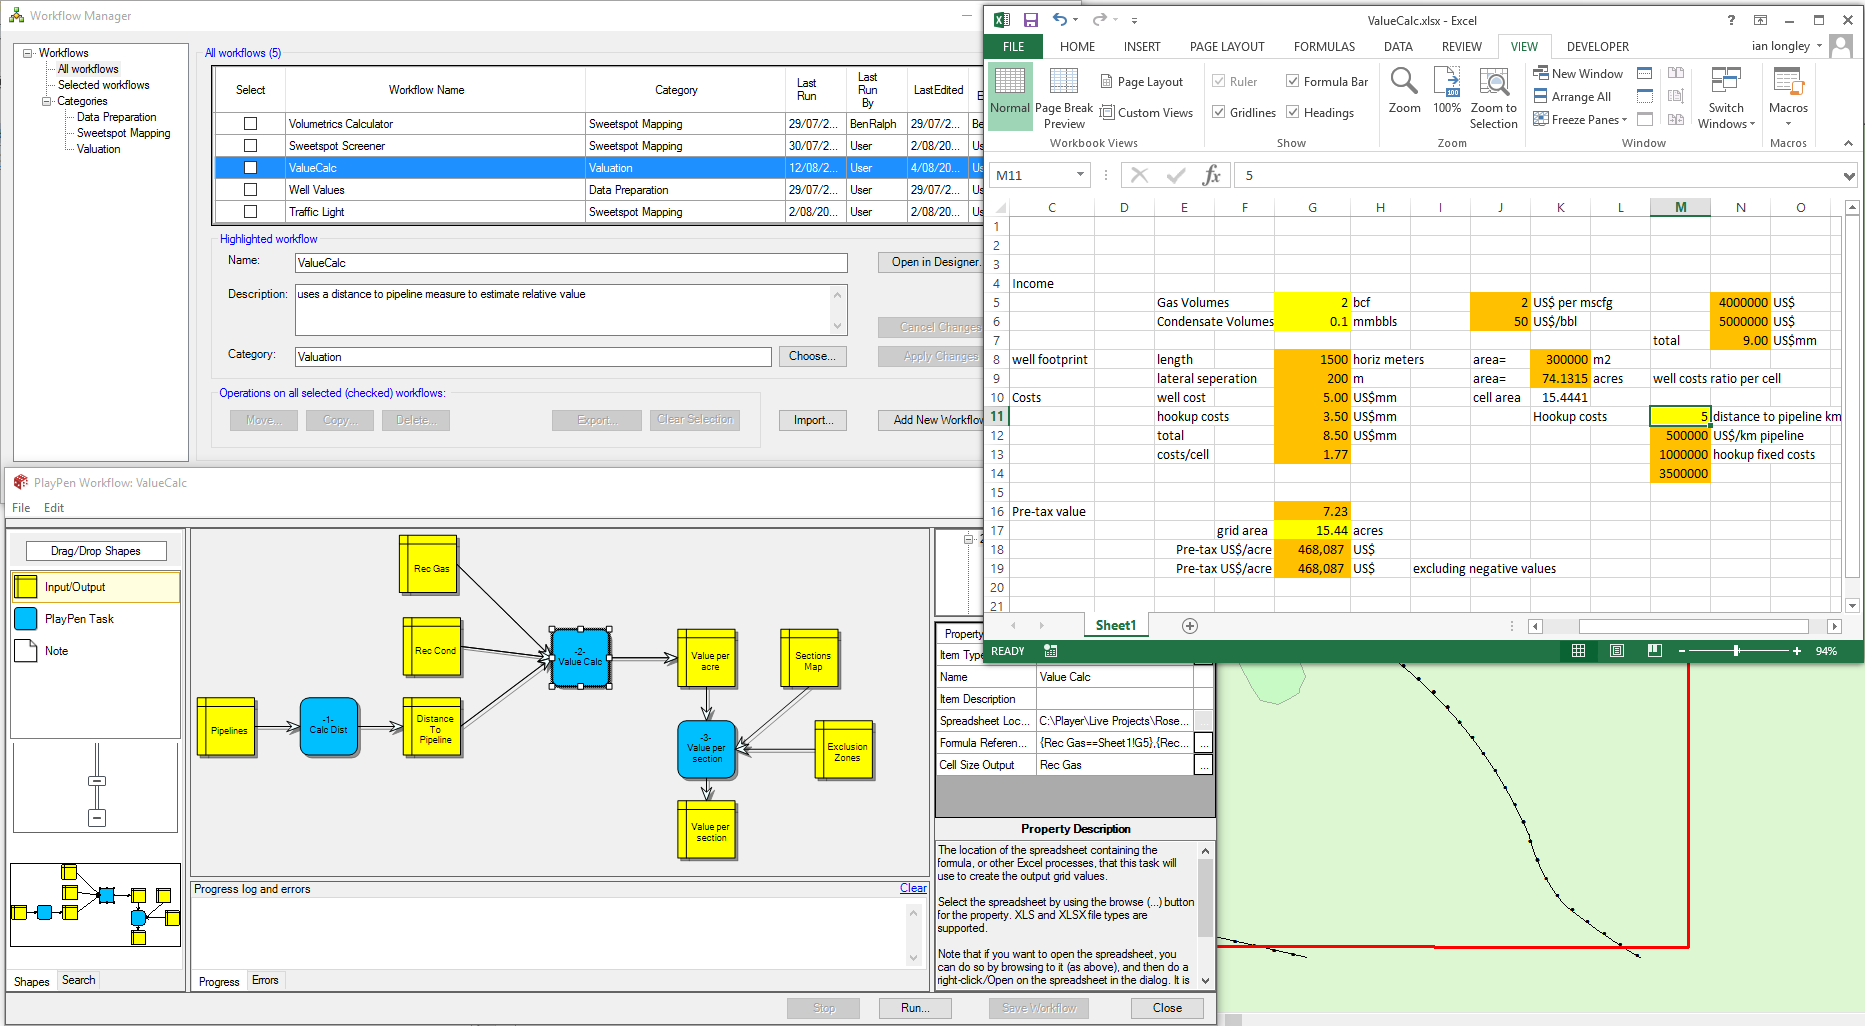
The engine for grid or polygon analysis in PlayPen is Microsoft Excel. The user (typically with our support desk help) decides what the analysis of grids or polygons will be and the excel sheet is the actual engine that drives the required output. We have done this because every geologist uses Excel as a base tool and in this way complex calculations like gas expansion factors or economic evaluations requiring distance data etc can be easily made into maps for qualitative or quantitative analysis. Player includes all of the functionality in PlayPen, however PlayPen as a subset of Player is an effective tool for companies that want to start out with a cost effective option.
PlayPen is sold under the same licensing model and structure as Player licenses with single PC (node locked) and regional floating licenses available for purchase.
Finding Sweetspots- Qualitative Unconventional Evaluations
A description of the power of PlayPen to make unconventional evaluations is shown in these series of images below:
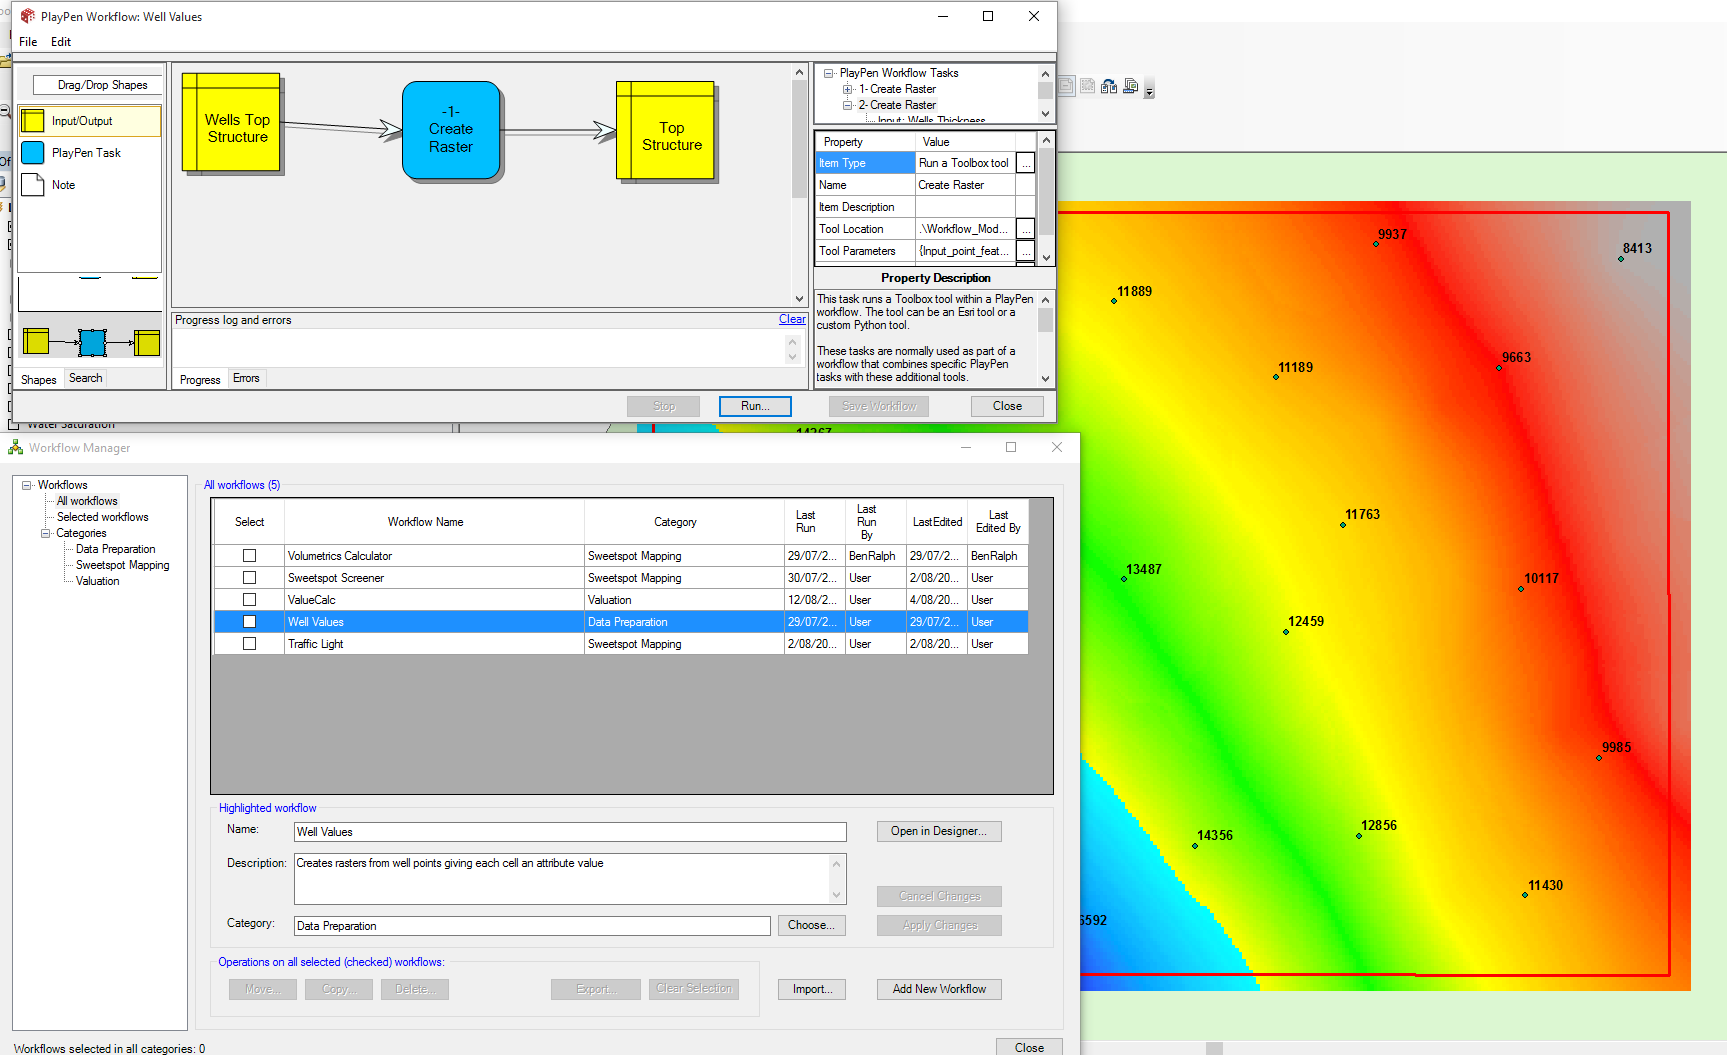
The export of well values from Accumap or other third party databases into arcshapefiles which are then turned into a grid surface using a PlayPen workflow linked to an arc raster manipulation tool…
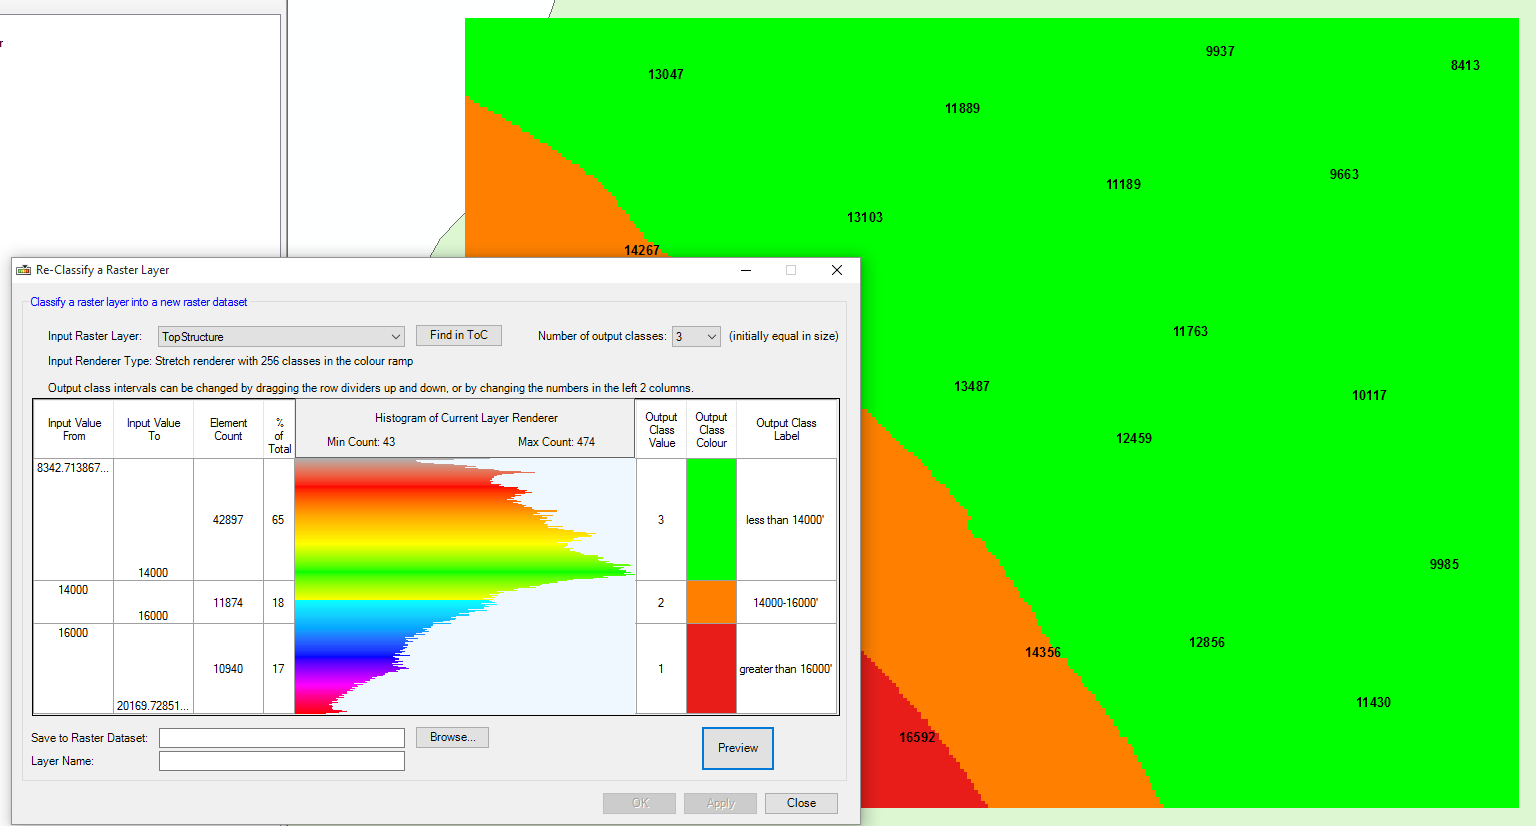
This is done for various well elements- a PlayPen workflow is used to make various sweetspot maps – the one shown here is the traffic light variety where each element is divided into traffic light windows using the “reclassify a raster dataset” tool as shown below. The tool is pointed at the depth grid, then a histogram of the raster values as shown below is displayed and the user can select to divide this distribution into any number of divisions. In the example below, the user has divided the histogram into 3 divisions, that can then be coloured, given a value and some description, and then this output can be saved. This process is done for all the elements separately, then all of these traffic light maps are stacked.
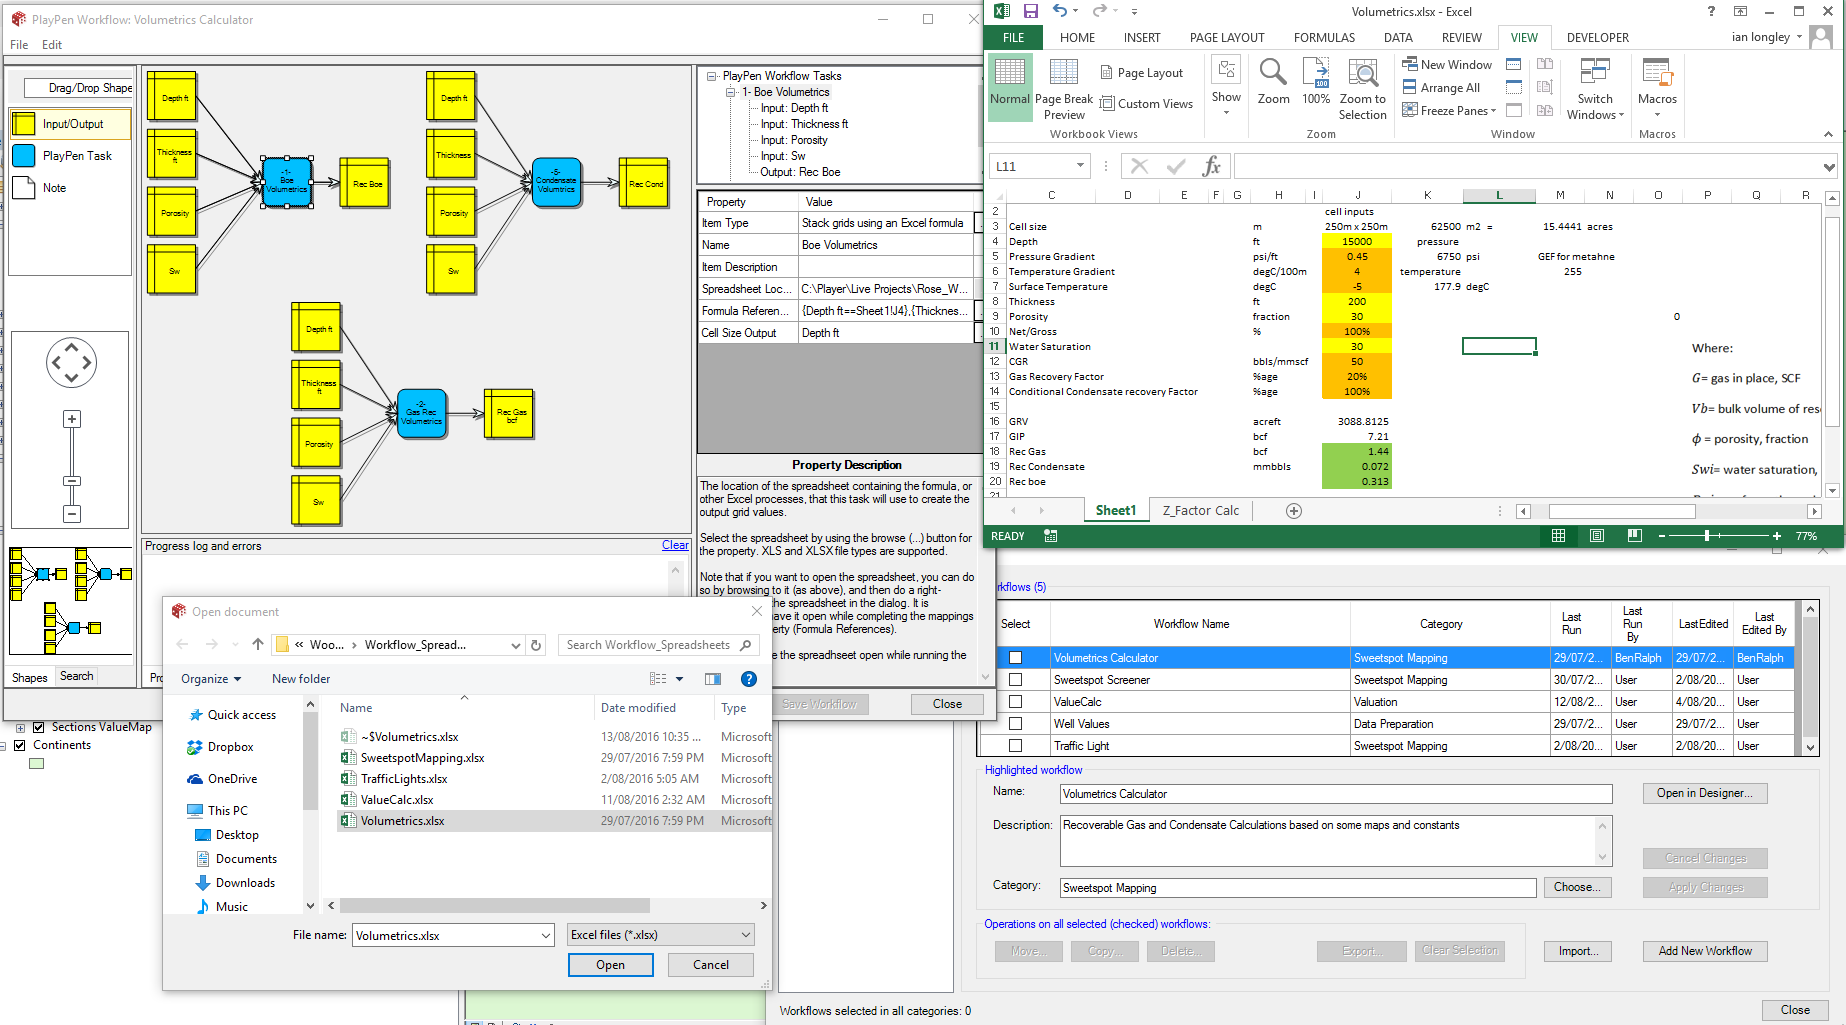
The traffic light stack process uses a PlayPen workflow as shown below where the traffic light workflow is set up to point to all the traffic light maps which are grid node by grid node pumped through the excel spreadsheet to make a raster output creating the sweetspot output map as shown. This process is quick to set up and easy to modify…


Economic Analyses using PlayPen – Quantitative Play Assessments
In this example PlayPen is used to calculate in place and recoverable volumes using constant recovery factors which in the real world would probably be well points where the recovery factor was estimated from production data decline curve analysis. In this case the gas expansion factor is calculated in each grid cell using a pressure gradient and geothermal gradient constant applied to the depth maps in excel. This GEF is complex and shows how PlayPen can simplify many of these difficult estimates.
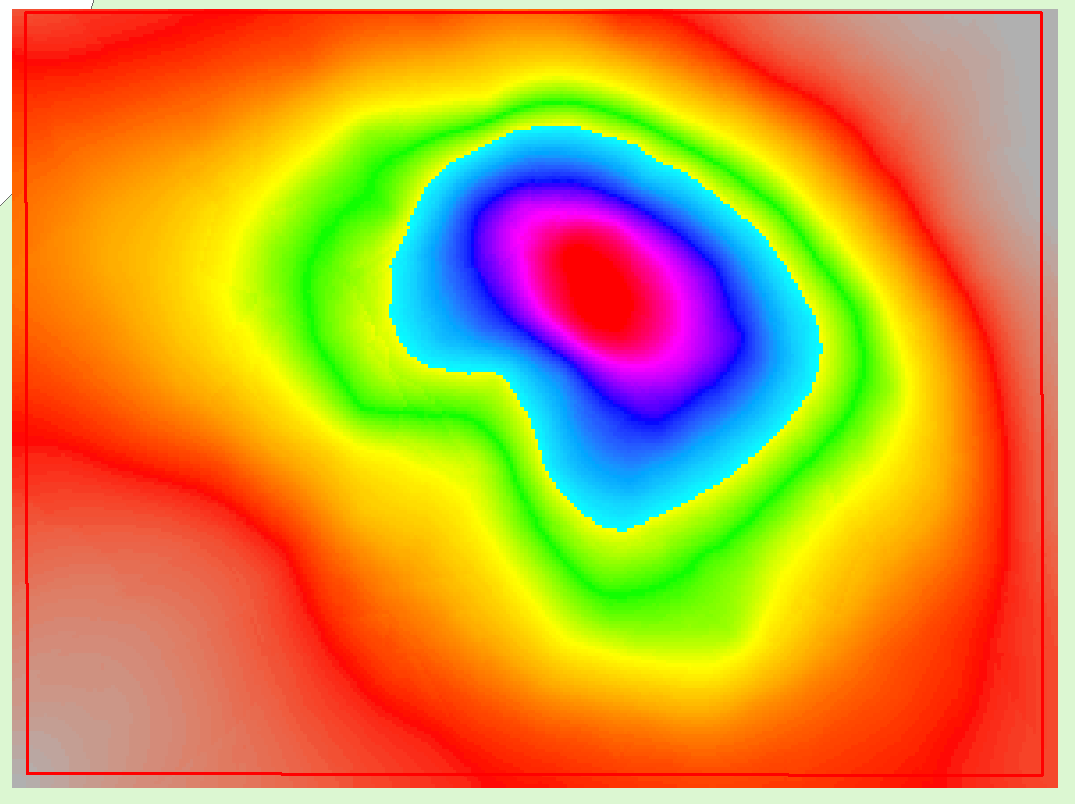
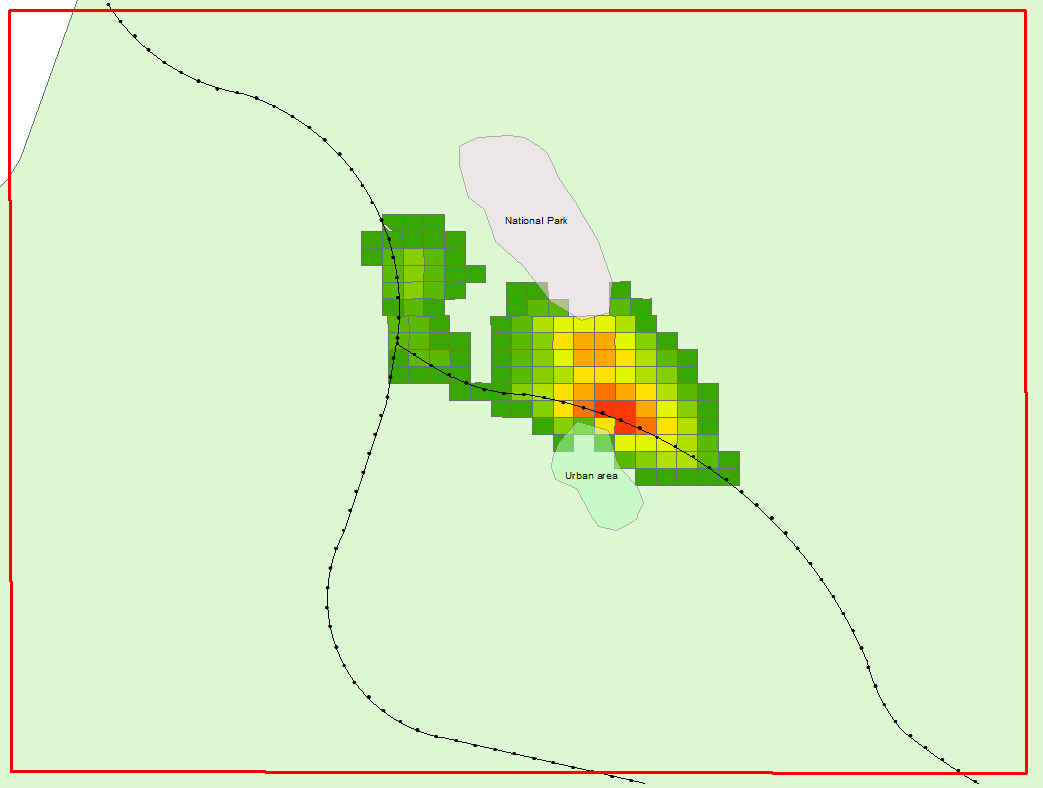
Below, we have made an example of an economic evaluation. In this case the distance to pipelines is calculated and a unit cost applied to any development tieback. This cost is added to the cost of a generic horizontal well (with an assumed spacing and drainage) and this total cost is balanced against the income generated from the recovered volumes (estimated from the “what can the rocks give us” evaluation described above). In this simple example we can calculate the value of each grid node then roll these up into the blocks so that a total value of each bid block can be estimated. The numbers are rough but the output provides a heat map that is based on user inputs and models and is the key map needed for decision making.
PlayPen is a flexible tool where your existing excel evaluations can be spatialized and these can make key maps quickly. Our helpdesk will help you with the process and once they are made they are easy to update and modify.