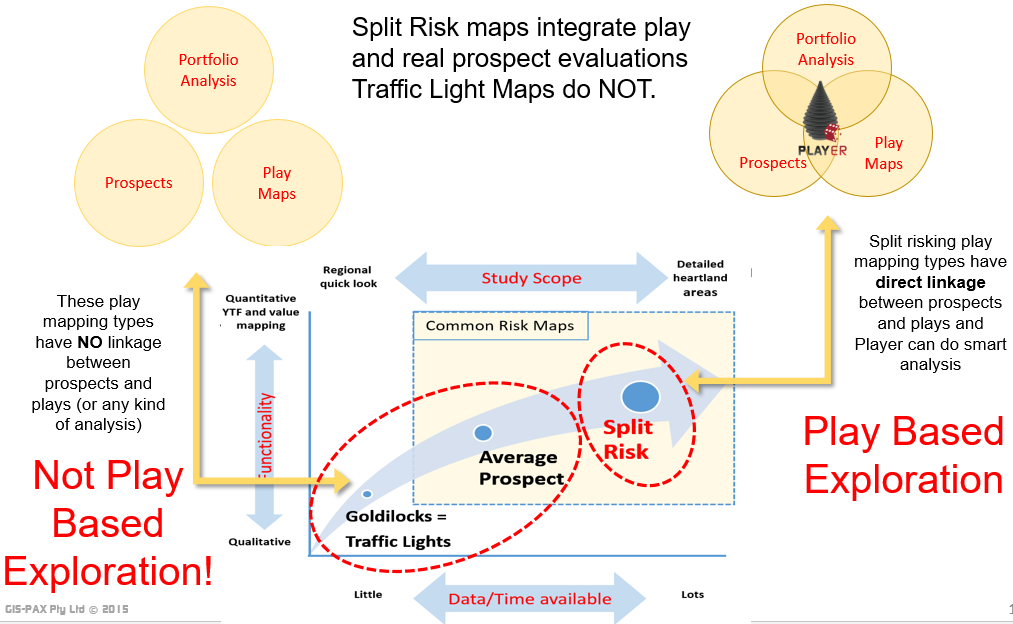
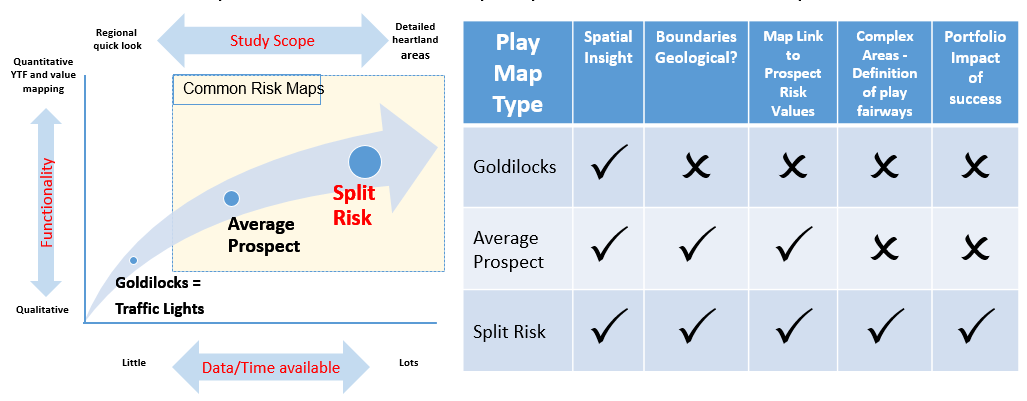
Traffic Light maps vs. Split Risking
The full evaluation process for conventional play analyses can be defined in many ways but all of them try to make map estimates of reservoir, seal, and charge (with or without trap) play chance elements on an interval by interval basis with the results stacked to highlight better areas from less prospective areas.
There are two main types of play map styles used in the industry today: Traffic Light Maps & Split Risk Maps
Both play mapping types give spatial focus and are useful as it means we can focus our limited resources efficiently on the right risk element evaluation in limited areas- preferably BEFORE we start mapping bumps and talking about amplitude extractions without all the information.
Traffic Light Maps are typically qualitative evaluations of reservoir, seal and charge where each element is split into bad/red, good/green and orange/no data or ambiguous polygons and then the result is stacked with the worst/reddest colour going into the composite stack.
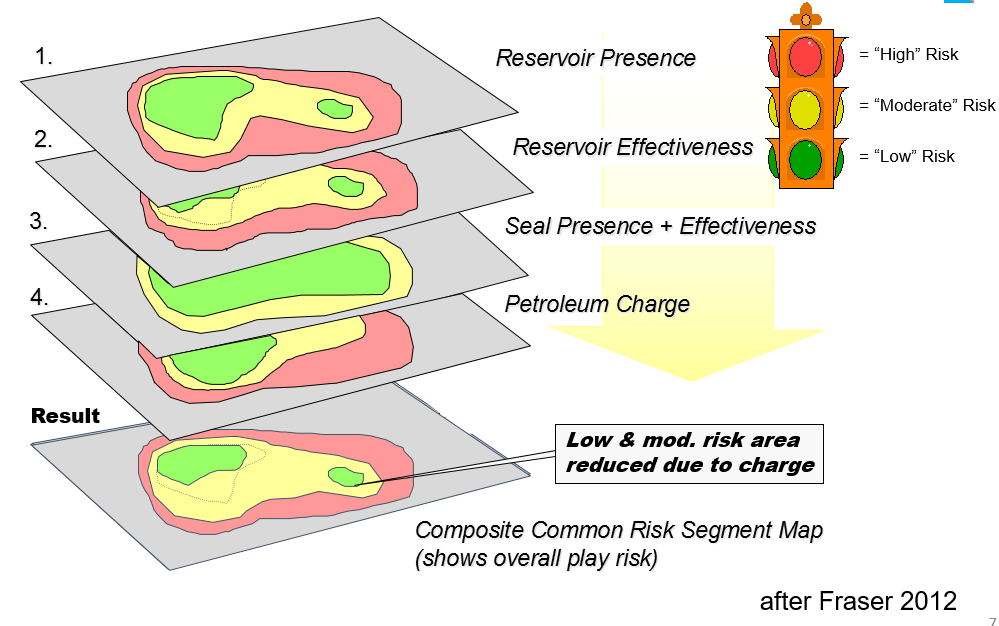
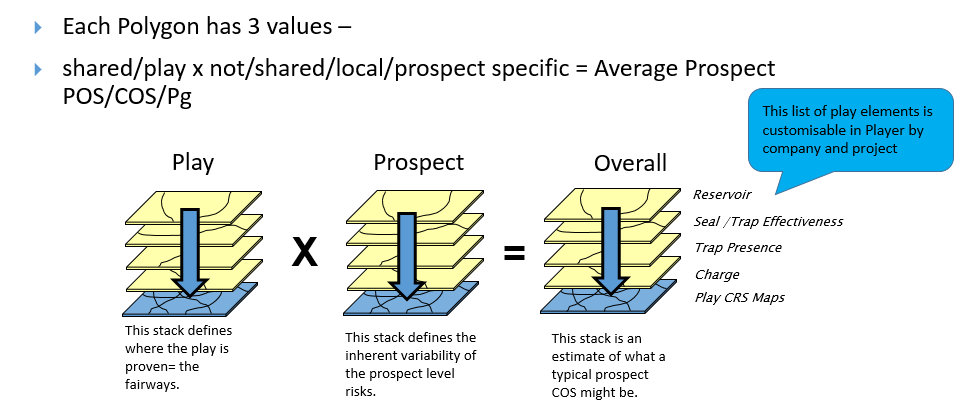
Split Risk Maps are quantitative evaluations where the prospect risking structure of the company is emulated in map form – typically Reservoir Presence, Reservoir Effectiveness, Top Seal, Trap Effectiveness, Trap Presence and Charge (=Source Presence /Source Maturity/Charge Timing & Charge Migration) risk elements in different mathematical combinations. The aim is to produce average prospect risk maps where each polygon estimate has an estimate of the shared vs local risk elements for that polygon.
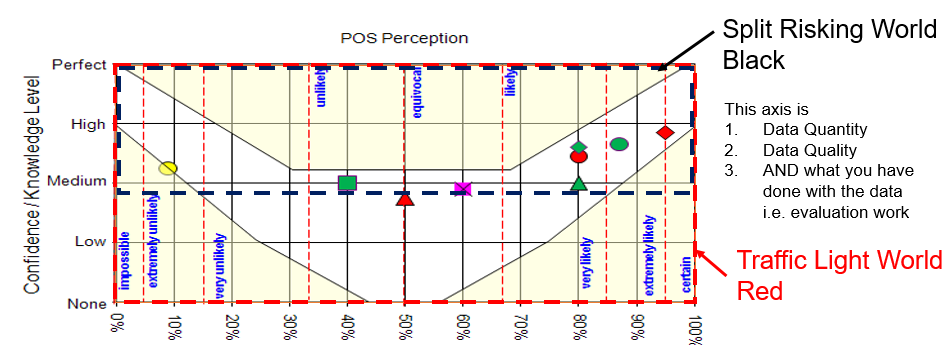
The obvious question is when and why to use the different type of maps and the answer is in low data areas/reviews you can only really use traffic lights whereas in more data rich areas – typically more mature areas where more seismic and well data is available – it is recommended to use split risk maps because the amount of work is effectively the same but for the same effort you get a number of significant evaluation advantages;
Split Risking Maps are more useful because:
- There is a direct numeric link between the play maps and the prospect risking estimates. This greatly helps the prospect review process as we all know that peer reviews on a prospect will come up with different values if held with different people. This is why when we compare prospects evaluated over a long time period in core exploration areas we get such amazing discrepancies between adjacent similar features.
- In areas with complex geology the play fairways can be readily defined and identified, We can quantify the impact of success of one prospect on others.
In summary, when users make split risking maps and integrate prospectivity estimates (identified and unidentified) then in Player they can integrate all these data into portfolio analyses. Traffic light maps with no prospect data just do not make the grade in conventional play analyses!