
Project Lifecycle
The three steps of the Project Lifecycle:
- Building Projects- “The Foundation”- Defining the polygon and project area.
- Analysing the Project- Loading data, QC and correction of data, producing maps & products.
- Archiving the Project and project data- Preserving the corporate knowledge, time & money invested by companies in the project building and analysing process.
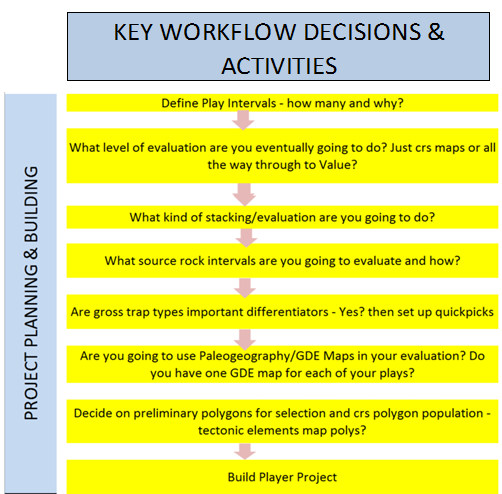
Building Projects
When building a Player project the first question to ask is: How big is my project? (ie. polygon?). This will determine if your project will be confined to a specific basin or will be a larger regional screening project.
Most Player projects are basin specific and/or area specific. This is when you are analysing certain prospects within a defined area or when you have been given a specific task on held acreage or areas within a bid round.
Basin Specific projects: Our customers typically have historical maps, evaluations, spreadsheets and databases that we import into a new project built around well, field and block data from S&P Global Energy or Woodmac subscription data. This build process has been streamlined in the case of S&P Global Energy data so that user defined play divisions loaded with S&P Global Energy pool data can be made into a project in less than 30 minutes. A video showing how easy this process is shown on our website. We teach your GIS/support people how to do this so that you can make projects over any area for any play interval set anytime you wish. Player has the full set of conventional discovery, well failure and prospect tools that are needed to properly evaluate conventional plays.
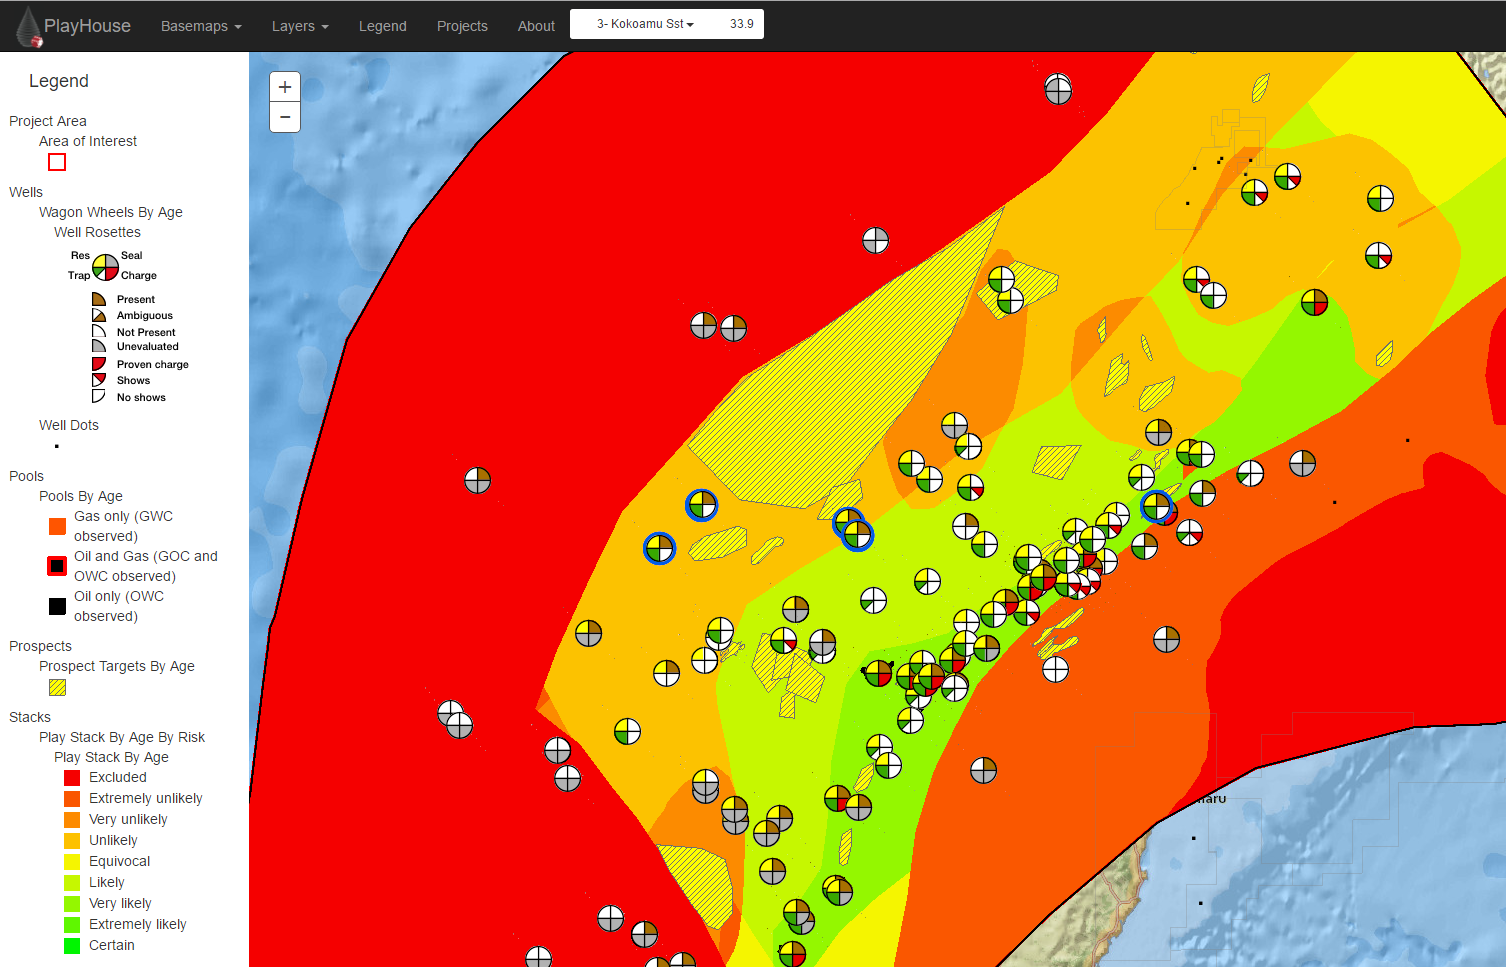
Once the S&P Global Energy or other well data has been loaded into your project, the next step is understanding which plays (and trap types) have been tested where and when? which have worked? and why have different plays failed in different areas? The first step is loading the discovery data into your play divisions and enabling you to correct the inaccuracies and add your proprietary discovery data so that you can see for each interval where the hydrocarbons are and where the wells have failed.
Whatever level of analysis you do the QC of the evaluation process helps calibrate the exploration history so that meaningful plots and maps (using your corrected data) can be made that help give insight into the remaining prospectivity. Over 30 Player play level standard plots can be generated using the data you have loaded and corrected with proprietary data.
You can also have large scale regional projects that are typically used by ‘New Ventures’ teams to understand the relative prospectivity across different basins or countries.
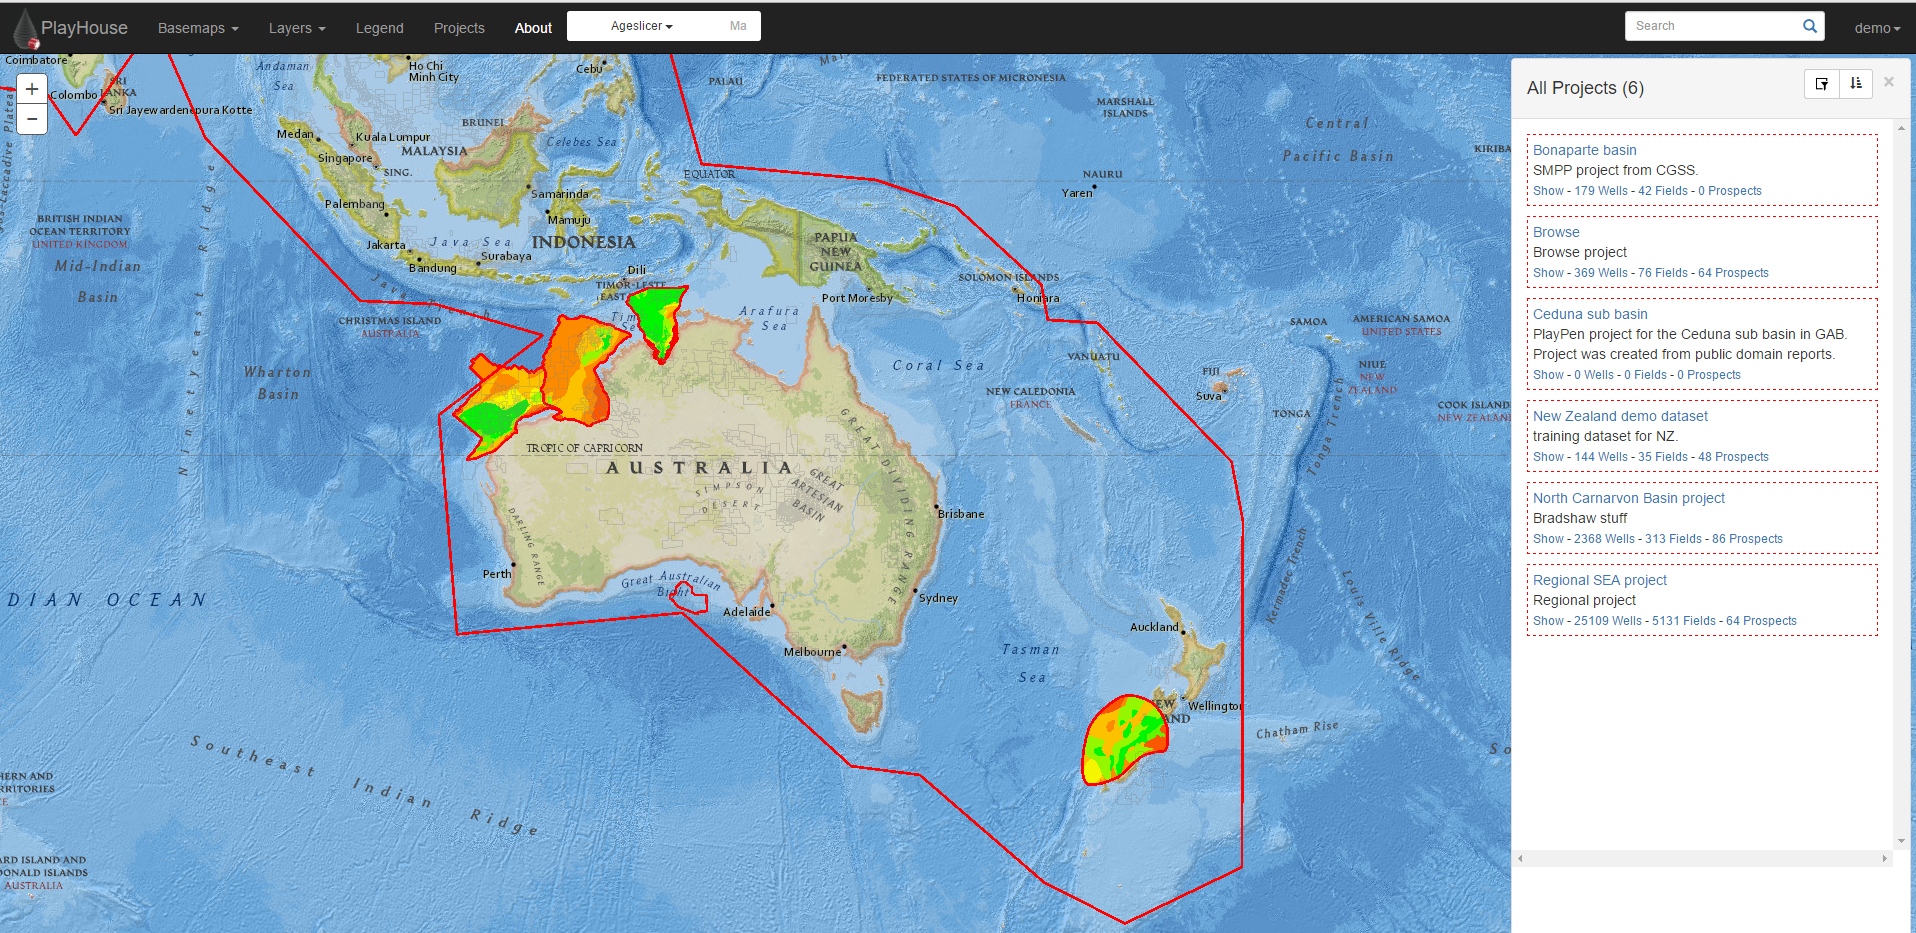
Regional Screening
Conventional Player projects were originally designed to help geologists evaluate and understand the potential within a defined area where the defined play intervals were applicable. Typically this is a geological “basin” and new projects are made in adjacent areas where the plays typically differ.
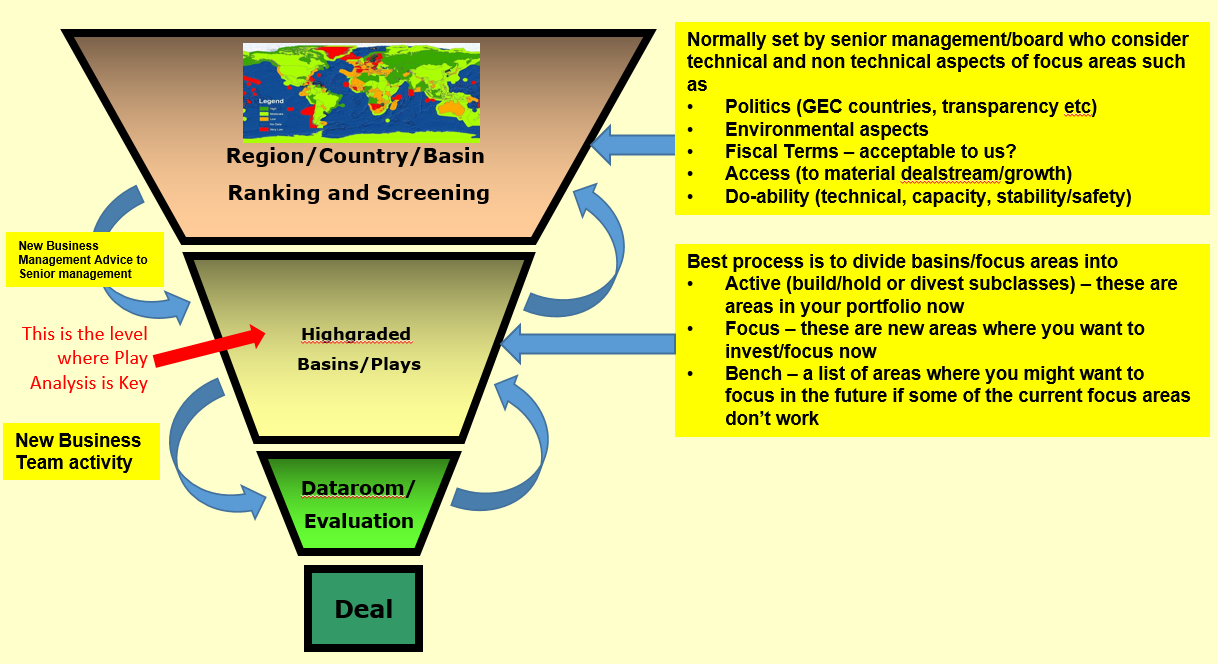
However, in many areas the major regional divisions between plays are common over large areas and multi-basin projects can be made using a common play division structure. We call these regional screening projects and users typically do not input play by play data into these projects. Instead they are used to answer technical questions that help highgrade basins for more detailed evaluations, ie. which basins are “creamed” and which are still growing? In those growing basins we ask which are the plays that are the growth plays? What is the exploration record in deep water? Basin X, Country Y etc etc. A typical company view of screening vs play/basin evaluation vs deals is shown below:
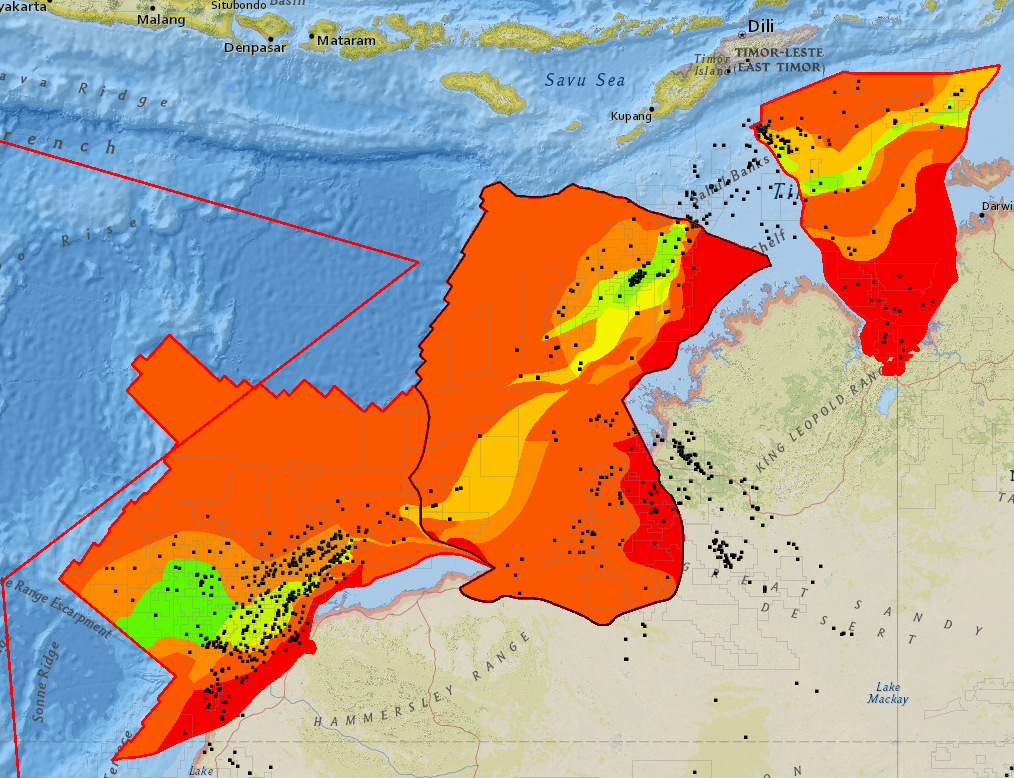
An example of a set of polygons added to a regional SE Asian Screening project is shown below:
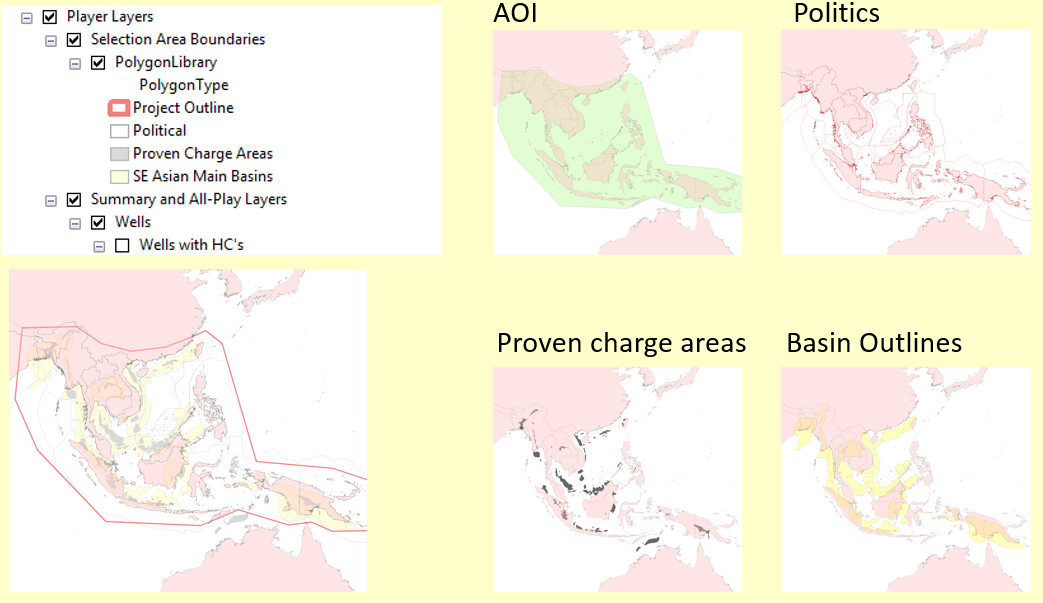
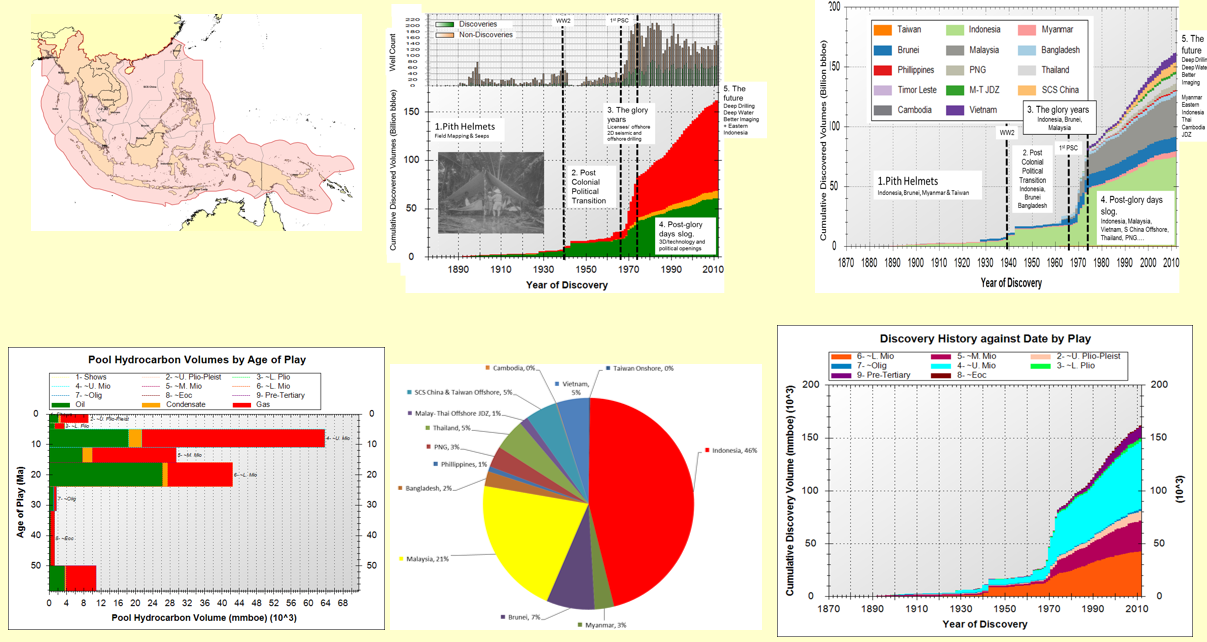
Using these polygons it is easy to show how oil and gas has been discovered through time, which countries or plays have dominated, and where the oil and gas actually is…essentially this is a set of overview prospectivity slides that you will need/want if your job is to decide where to go in a region and why.
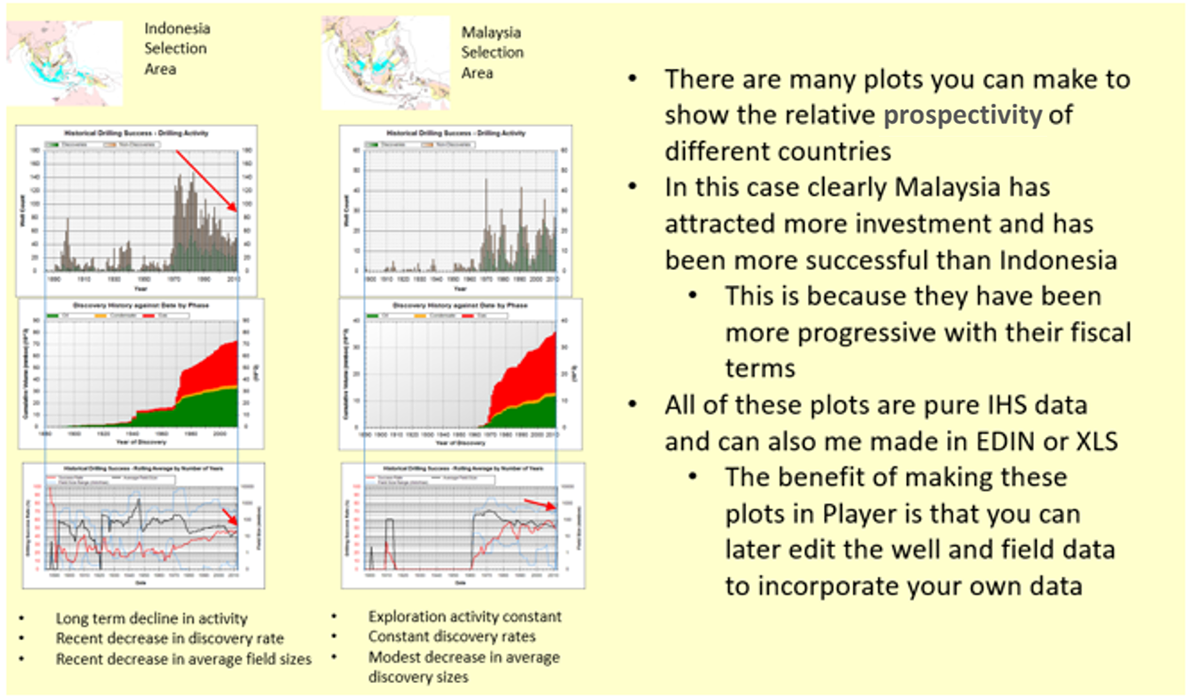
At the next level down it is easy to show relativity between basins or countries or any set of polygons in your project. In the example below Indonesia vs Malaysian exploration records are compared using data from the regional screening project. It compares drilling activity, discovered volumes and rolling average success rates and discovery sizes…
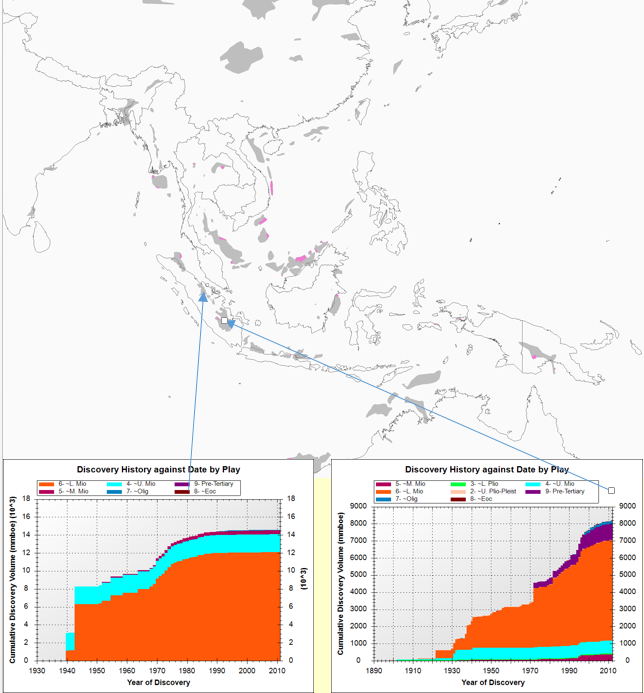
At a basin level it is easy in these projects to compare creaming curves from different basins. Here we are comparing two adjacent basins in Sumatra Indonesia. One is clearly creamed and is dominated by one creamed play interval and the other has continued to deliver in part because of the addition of new play intervals. These data can also be viewed on maps by play level so it’s clear spatially where these new play areas are.
For these projects and normal Player projects we always recommend making proven charge polygons. These are outputs from play evaluations and basin stacks if a full multi-play evaluation is done on a basin but if this detail is not available a user can make a simpler version by simply putting a polygon around the proven fields. These polygons are now available with your S&P Global Energy subscription from late 2016. They are key because outside of these polygons the success rate is zero so if a user selects a basin polygon the well success rate will always be lower than the proven charge polygon number and therefore will be misleading. The key question to ask is are there any other polygons that will be found in the future? (normally a new charge kitchen) and how will the existing charge polygon change both laterally and stratigraphically?
Many of our customers have regional screening projects built and then have detailed Player projects built and active in the same region. In summary, screening projects are typically used over large areas where common play intervals can be defined by the user. Data can be quickly loaded from the S&P Global Energy portal and once key polygons are loaded then the data can be “sliced and diced” easily using the Player tools and functionality to give insight into prospectivity.